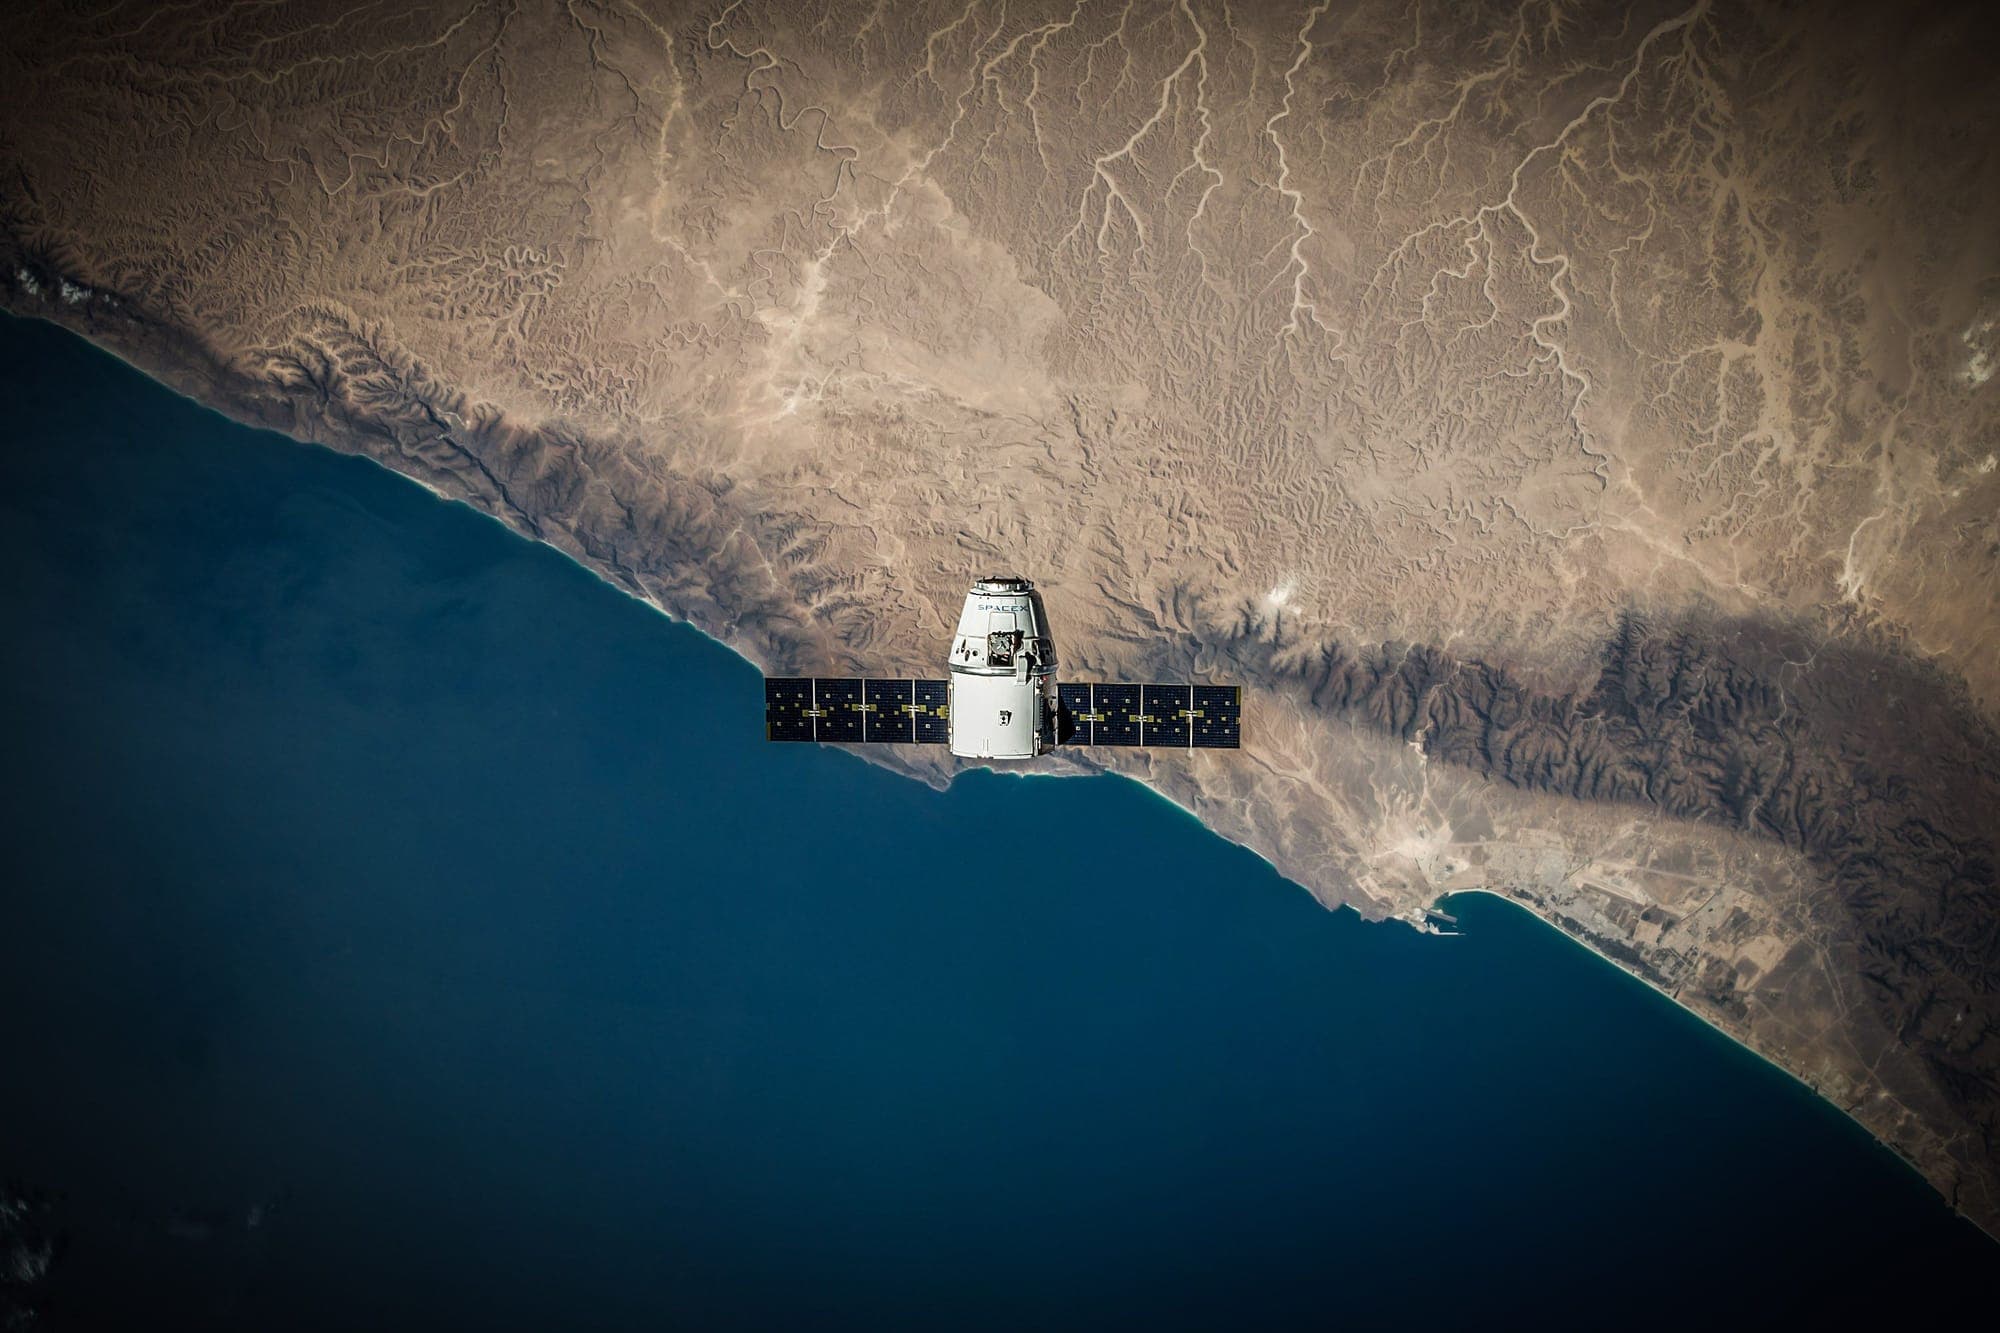
From Satellite Imagery to Risk Scores: How Climate Hazard Mapping Tools Are Changing the Way Insurers Think
Climate-related disasters cost India an estimated $12 billion in 2025 alone. According to Swiss Re, 93% of those losses were uninsured. For insurers and the banks financing exposure in affected regions, this is no longer a peripheral concern. It directly impacts the balance sheet.
Climate hazard mapping tools are changing how insurers understand, price, and manage weather-related risks. By combining satellite imagery, geospatial intelligence, and AI-driven climate models, these tools convert raw environmental data into location-specific risk scores that support more accurate underwriting, better portfolio management, and faster climate-linked insurance decisions.
Satellite imagery, geospatial data, and AI are helping insurers turn climate hazards into location-specific risk scores for better underwriting and portfolio management.
Written byArnav PatnaikProgram Manager, Founder's Office

Why Underwriting Climate Risk Without Location Data Does Not Work
Traditional underwriting relies heavily on historical averages. An insurer uses past claims records and regional risk information to price a policy. That approach worked better when weather patterns were relatively stable and geographic variation was less pronounced.
That assumption no longer holds.
The problem is not simply that extreme weather events are becoming more frequent. It is that their impacts are increasingly concentrated, erratic, and highly location-specific. A national flood average tells an underwriter very little about the risk of insuring a warehouse in the Brahmaputra floodplains versus a cold-storage facility on higher ground in Pune.
According to the IMD's Climate Hazards and Vulnerability Atlas of India, 87% of India's districts are susceptible to droughts, 30% are at risk of floods, and 14% are vulnerable to cyclones. Many districts also face multiple overlapping perils across different months of the year.
Without spatial, location-level data, a policy priced using broad regional averages will either overcharge lower-risk policyholders or underprice higher-risk ones. Both outcomes create problems for insurers.
What Climate Hazard Mapping Tools Actually Do
Climate hazard mapping tools are data systems that assign risk scores to specific geographic locations based on their exposure to weather and climate perils. Their outputs are commonly presented through GIS climate risk mapping interfaces, allowing insurers to visualise exposure across individual properties, districts, portfolios, and regions.
A typical climate hazard mapping system combines several data streams:
- Satellite imagery: Monitoring land cover, soil moisture, standing water, vegetation stress, and other indicators in near-real time
- Weather station data: Rainfall, temperature, wind speed, and other observations from ground-based monitoring networks
- Topographic data: Elevation, drainage density, river proximity, and terrain characteristics that influence how hazards develop locally
- Historical loss records: Claims and disaster records used to calibrate model outputs against observed events
The output is not simply a weather forecast.
Instead, it is a risk score: an estimate of how likely a specific location is to experience a particular peril at a given severity over a defined time period.
That score can then be updated as new satellite observations, weather measurements, and climate model outputs become available. This creates the foundation for real-time weather risk monitoring rather than relying entirely on static historical assessments.
How This Changes the Underwriting Process in Practice
Consider an insurer developing a parametric product for solar energy farms across Rajasthan and Gujarat.
Both states fall within a broadly similar climate zone, but their local risk profiles can differ significantly. District-level GIS climate risk mapping may reveal meaningful differences in dust-storm frequency, hail exposure, and extreme-heat duration, all of which can affect solar-panel performance and physical damage probability.
Without that resolution, an insurer has two choices: apply a blended premium across both regions or avoid writing the exposure because the risk is difficult to quantify.
With AI-powered climate risk modeling and geospatial data, the insurer can:
- Pull historical solar irradiance and hail-event data by district
- Assign a hazard score to each solar farm's coordinates
- Identify the specific climate perils most relevant to each asset
- Set a trigger threshold that reflects the actual risk at that location
- Price the premium against a specific, independently verifiable index
This is where parametric insurance and hazard mapping tools fit together particularly well.
Parametric products depend on measurable triggers. The quality of the product therefore depends heavily on whether the trigger has been designed around the actual hazard characteristics of the insured location.
Better climate hazard mapping helps insurers answer a fundamental question: What should the trigger be, and where should it apply?
What Hazard Mapping Means for Real-Time Risk Management
The shift from static maps to live monitoring changes how insurers manage portfolios after a policy has been sold, not just how they price it beforehand.
Real-time weather risk monitoring can allow an insurer to track whether a cyclone is approaching a cluster of policyholders, estimate potential portfolio exposure before a trigger is reached, and communicate proactively with customers about impending weather events and coverage conditions.
This matters for two reasons.
First, it improves capital planning. An insurer that can identify a developing weather event and estimate its potential portfolio impact has more time to prepare liquidity and capital for potential payouts.
Second, it can improve operational certainty. Parametric policies rely on predefined and independently verifiable data points such as rainfall, temperature, wind speed, or satellite-derived measurements. When the underlying data is transparent, there is less scope for disagreement about whether the contractual trigger was reached.
For insurers managing thousands of geographically distributed policies, this combination of mapping, monitoring, and automated trigger verification can significantly reduce the operational burden of climate-linked insurance.
Where Climate Hazard Mapping Tools Still Fall Short
No mapping system removes uncertainty entirely. Current climate hazard mapping tools still face several important limitations.
Spatial Data Gaps
Remote districts, tribal areas, and high-altitude regions can have limited ground-based weather station coverage. Satellite data can partially address these gaps, but ground validation remains important for ensuring that remotely sensed measurements accurately represent local conditions.
Historical Record Length
Many locations have reliable digital weather records covering only a few decades. That can make it difficult to model rare, high-severity events such as once-in-50-year floods or cyclones with high confidence.
Model Disagreement
Different climate risk platforms can generate different risk scores for the same location depending on the datasets, assumptions, algorithms, and spatial resolution they use.
An insurer relying exclusively on one model therefore needs to understand the model's methodology, uncertainty ranges, and validation record before incorporating its outputs directly into underwriting decisions.
Trigger Calibration Risk
Even with accurate hazard data, setting a trigger at the wrong threshold can create basis risk: the gap between the conditions recorded by the index and the actual loss experienced by the policyholder.
Strong climate hazard mapping can reduce this gap, but it cannot eliminate it entirely.
The most effective approach is therefore to combine climate intelligence with local ground observations, underwriting expertise, historical claims experience, and regular model recalibration as climate patterns evolve.
Wrapping Up
The gap between what climate data can show and what underwriters traditionally use is closing.
Satellite coverage is expanding, weather datasets are becoming more granular, and government infrastructure such as the IMD's climate and hazard datasets is making location-specific information increasingly accessible. RBI-CRIS is also strengthening the standardisation of climate-risk information available to regulated financial institutions.
For insurers, the significance goes beyond better maps.
Climate hazard mapping tools can turn complex environmental information into underwriting variables: exposure scores, hazard probabilities, portfolio concentrations, and parametric triggers.
The next challenge is translating this improving climate intelligence into insurance products that are affordable, accurately priced, and accessible to the people and businesses most exposed to climate risk.
Thinking About Climate-Linked Cover?
If your business or assets are exposed to floods, droughts, heatwaves, cyclones, or other weather risks, explore whether parametric insurance products are available for your sector and location.
Understanding the underlying hazard data, trigger methodology, payout structure, and geographic resolution is an important first step in evaluating climate-linked protection.
00 Comments
Start the conversation
Be the first reader to share a thoughtful response.
Leave a Reply
Your email address will not be published. All comments are reviewed before appearing publicly.